賈浩楠 發自 凹非寺
量子位 報道 | 公衆號 QbitAI
「表哥表姐」們還在爲大量PDF文件中的表格發愁嗎?
百度一下,網上有大量提取PDF表格的工具,但是,它們都只支持文本格式PDF。
但掃描生成的圖片表格怎麼辦?
彆着急,一種使用深度神經網絡識別提取表格的開源工具可以幫助你。
兼容圖片、高準確率、還不佔用本地運算資源,如此實用的工具值得你擁有。
測試實例
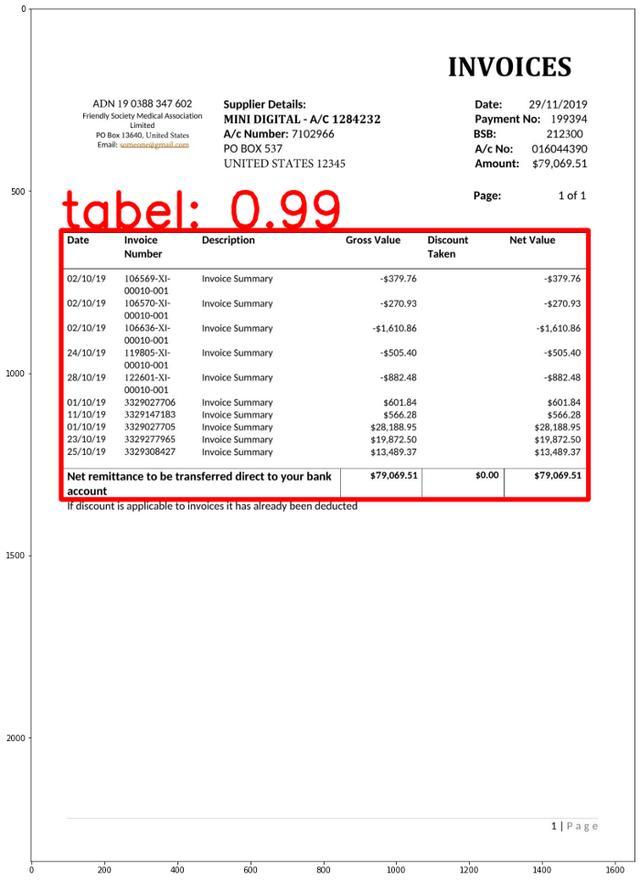
如果在輸入的PDF文件中檢測的表格,模型會在邊界框(bounding box)標出表格邊框:
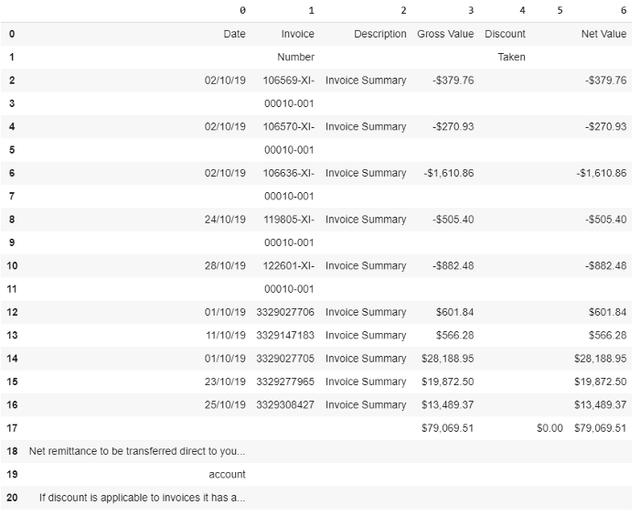
然後,表格數據會被轉化爲Panda數據框架,方便後續處理:
怎麼樣,是不是很實用?那這個工具如何使用呢?
使用姿勢詳解
神經網絡算法,還不佔用本地運算資源?
對,你沒聽錯,這個工具的所有代碼都可以在谷歌Colab上運行。也就是說你可以利用Colab雲端資源完成訓練和推理,無需本地安裝。
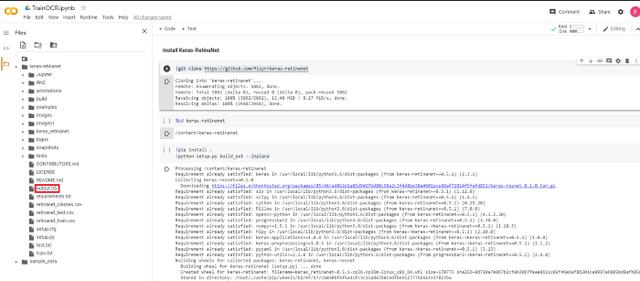
這個工具使用到的深度神經網絡是Keras-RetinaNet,首先要在Colab上安裝Keras-RetinaNet,通過一下一行代碼就可以完成:
git clone https://github.com/fizyr/keras-retinanet同時需要安裝必要的庫:
pip install .python setup.py build_ext — inplace
訓練Keras-RetinaNet識別表格
首先要構建或一個訓練使用的數據庫。
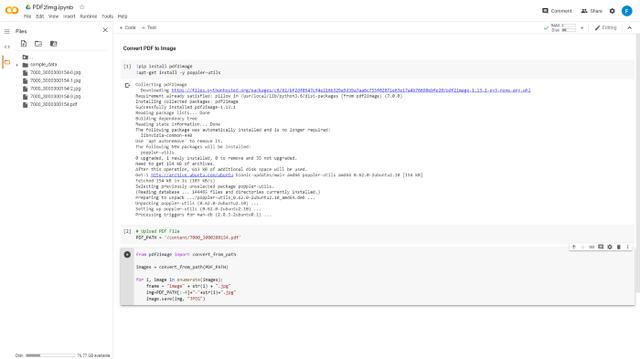
這裏要用到Colab工具PDF2Img,將PDF文件轉爲JPG格式供算法學習。
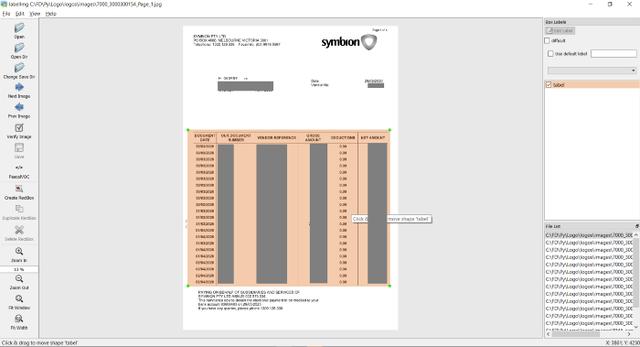
然後將轉好的圖片保存在Images文件夾中。接下來需要手動給這些訓練數據打標籤,這裏推薦使用在線標記工具makesense.ai。
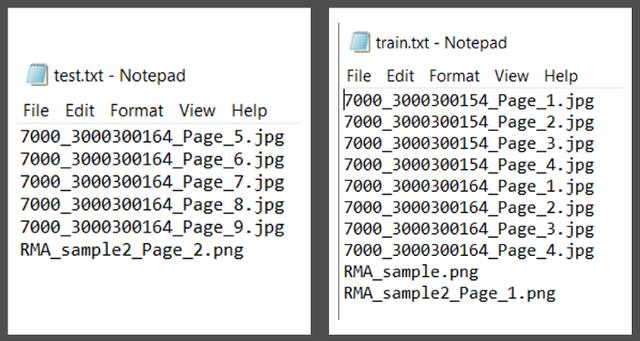
將XML註釋文件保存在註釋文件夾中,並創建用於培訓和測試的PDF文件列表,將該列表導入train.txt和test.txt中。
接下來,克隆Github項目https://github.com/ferrygun/PDFTableExtract,並安裝beautifulsoup。
運行以下命令以將PASCALVOC格式轉換爲Keras-RetinaNet所需的格式:
python build_logos.py

運行上述命令後,會得到retinanet_classes.csv,retinanet_test.csv和retinanet_train.csv。
在retinanet_classses.csv中,由於只識別PDF文檔中的表,所以只有到一個class,即class 0。
如果你在打標籤的過程中加入頁眉頁腳等標籤,相應能得到多個class。
完整的文件和文件夾結構的列表:
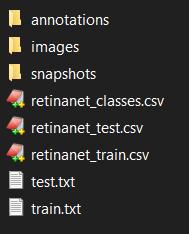
然後,將retinanet_classes.csv,retinanet_test.csv,retinanet_train.csv,train.txt和test.txt 導入keras-retinanet的根文件夾中:
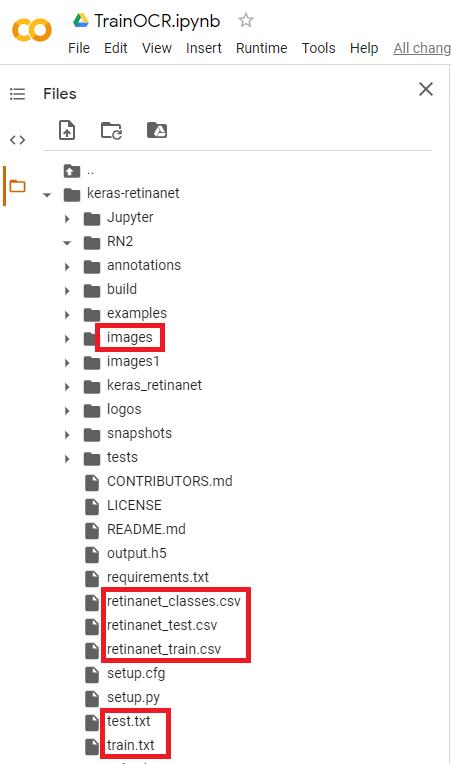
接下來,運行Colab TrainOCR,可以根據要訓練的JPG文件數量來調整訓練的epoch數量。
訓練完成後,就會得到權重文件output.h5,下載此文件並將其保存到本地主機。後面將使用該文件來運行測試。
這裏需要注意的一點是,在Colab中,已將文件上傳到Git並進行了Git克隆。
運行測試
運行測試前,還需要安裝處理PDF文件必要的庫。
PyPDF2是一個python工具庫,能夠提取文檔信息,裁剪頁面等。
使用以下命令安裝此庫:
pip install PyPDF2Camelot是專門用於解析PDF頁面表格的python庫。
使用以下命令安裝此庫:
pip install camelot-py[cv]PDF2IMG是將Python轉換爲PIL Image對象的python庫。
使用以下命令安裝此庫:
pip install pdf2imag在運行預測之前,需要使用從訓練中獲得的權重文件output.h5加載模型,並從retinanet_classes.csv定義標籤class 0。
model_path = ‘output.h5’model = models.load_model(model_path, backbone_name=’resnet50’)labels = ‘retinanet_classes.csv’LABELS = open(labels).read().strip().split(‘\n’)LABELS = {int(L.split(‘,’)[1]): L.split(‘,’)[0] for L in LABELS}print(LABELS){0: ‘tabel’}接下來運行測試
import numpy as npimport cv2import matplotlib.pyplot as pltimage_path = imgfname#image = cv2.imread(image_path)image = read_image_bgr(image_path)image = cv2.cvtColor(image, cv2.COLOR_BGR2RGB)output = image.copy()output = cv2.cvtColor(output, cv2.COLOR_BGR2RGB)print(output.shape) # row (height) x column (width) x color (3)image = preprocess_image(image)(image, scale) = resize_image(image)image = np.expand_dims(image, axis=0)# detect objects in the input image and correct for the image scale(boxes, scores, labels) = model.predict_on_batch(image)boxes /= scaleconfidence = 0.2from google.colab.patches import cv2_imshowimport matplotlib.pyplot as pltlabel_out = []result = ""# loop over the detectionsfor (box, score, label) in zip(boxes[0], scores[0], labels[0]): # filter out weak detections if score < confidence: continue # convert the bounding box coordinates from floats to integers box = box.astype("int") # build the label and draw the label + bounding box on the output # image labeli = label label = "{}: {:.2f}".format(LABELS[label], score) print(label) if LABELS[labeli] not in label_out: label_out.append(LABELS[labeli]) cv2.rectangle(output, (box[0], box[1]), (box[2], box[3]), (255, 0, 0), 12) print(box[0]) print(box[1]) print(box[2]) print(box[3]) #result cv2.putText(output, label, (box[0], box[1] - 10), cv2.FONT_HERSHEY_SIMPLEX, 4.5, (255, 1, 1), 12)plt.figure(figsize=(20, 20))plt.imshow(output)plt.show()如果檢測的表格,模型會在邊界框(bounding box)標出表格邊框:
邊界框座標(x1,y1,x2,y2),將table_area輸入到Camelot read_pdf函數中,table_area是已標準化的邊界框。
interesting_areas=[]output = [[x1, y1, x2, y2]]for x in output: [x1, y1, x2, y2] = bboxes_pdf(img, pdf_page, x) bbox_camelot = [ ",".join([str(x1), str(y1), str(x2), str(y2)]) ][0] # x1,y1,x2,y2 where (x1, y1) -> left-top and (x2, y2) -> right-bottom in PDF coordinate space #print(bbox_camelot) interesting_areas.append(bbox_camelot)print(interesting_areas)output_camelot = camelot.read_pdf( filepath=pdf_file, pages=str(pg), flavor="stream", table_areas=interesting_areas)output_camelot[0].df這樣就可以將表格數據轉化爲Panda數據框架,方便後續處理:
圖片怎麼辦
針對掃描圖片格式的PDF表格,可以使用Ocrmypdf包來將圖片格式PDF轉爲文本格式。
Ocrmypdf是一個python軟件包,可將基於圖像的pdf轉換爲基於文本的PDF。
安裝ocrmypdf,可以通過以下命令行將其用於macOS和Linux:
brew install ocrmypdf通過以下命令調用:
ocrmypdf input_file.pdf output_file.pdf之後就可以按照上面的方法進行表格提取了。
怎麼樣,這款兼容圖片,又能白嫖谷歌GPU的PDF表格工具對你有幫助嗎?
傳送門
項目地址:
https://github.com/ferrygun/PDFTableExtract
在線打標籤工具:
https://www.makesense.ai/
—完—
@量子位 · 追蹤AI技術和產品新動態