神經網絡繪圖篇!本次爲大家介紹的是神經網絡的可視化工具和繪圖軟件。在搭建神經網絡以及後期論文寫作時,可視化的神經網絡模型將在很大程度上幫助我們直觀地理解模型結構和數據的流動。除了大家常用的 PPT+AI+PS 之外,小助手也爲大家整理了Github 上各路大神開發的繪圖軟件信息。
神經網絡繪圖軟件最新彙總
-
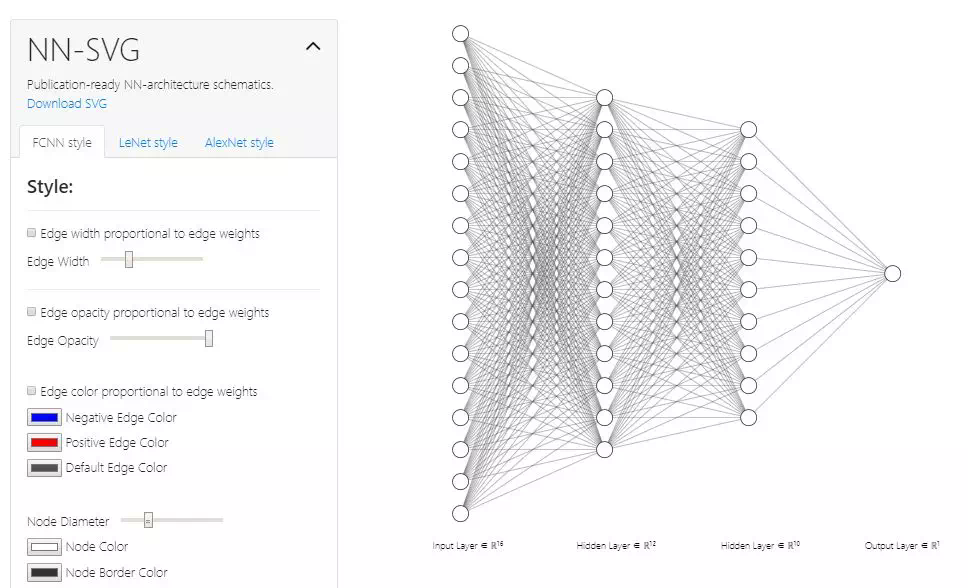
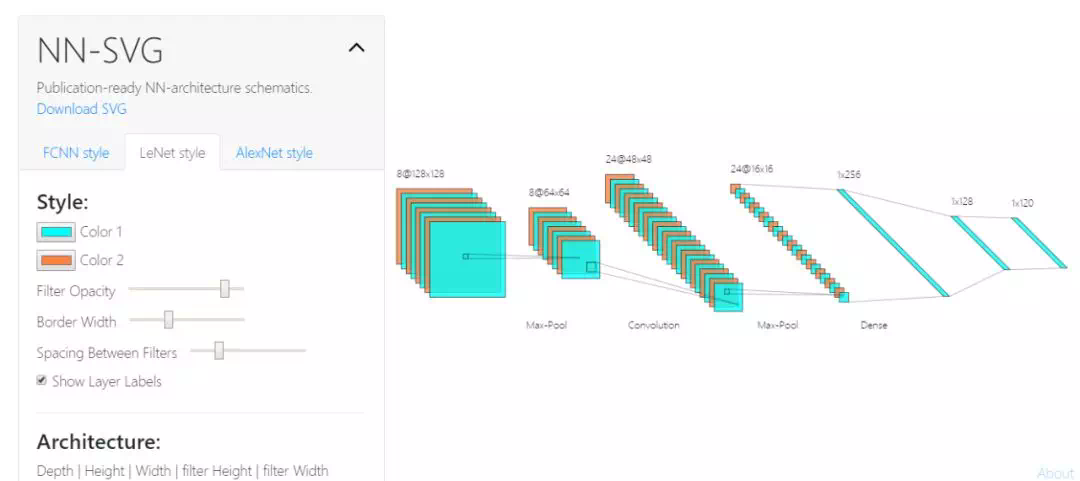
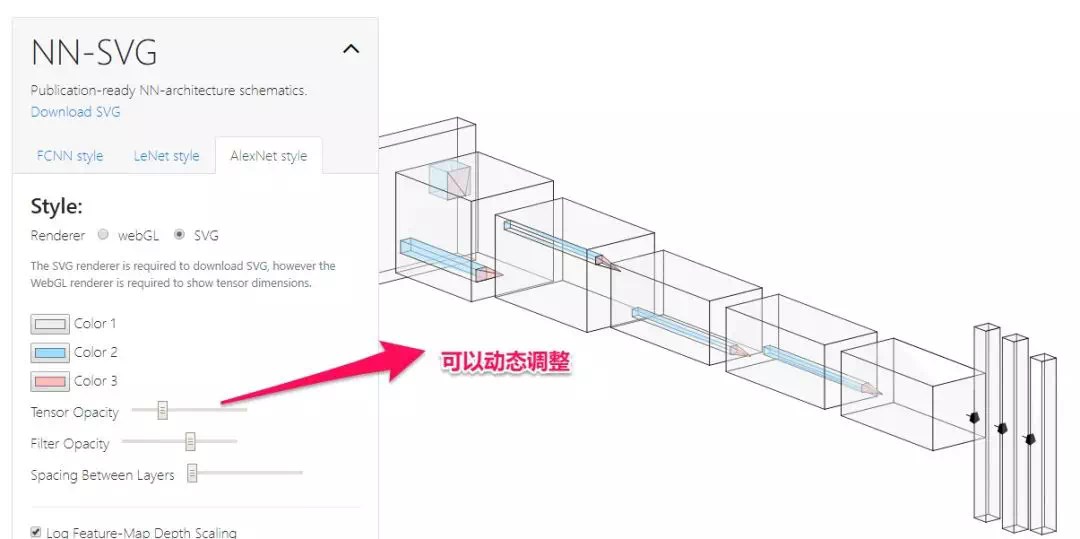
提供 三種典型 的神經網絡繪圖風格,個性化參數多 -
交互式繪圖
-
基於tikz的tex的宏指令繪製 -
繪製腳本繁雜
-
底層基於tikz的tex的宏指令繪製 -
上層提供基於python的描述框架,繪製腳本簡單 -
可繪製複雜的網絡結構
-
基於javascript和css繪製 -
僅支持基本Layer類型
-
簡單易用 -
底層基於matplotlib繪製
-
基於Haskell語言
計算圖
-
支持工具: ONNX, Keras, CoreML, Caffe2, MXNet, TensorFlow Lite, Caffe, PyTorch, Torch, CNTK, PaddlePaddle, Darknet, scikit-learn, TensorFlow.js, TensorFlow. -
提供運行方式: 瀏覽器, Python Server; macOS, Linux, Windows
-
caffe自帶的畫圖工具
-
非常易用 -
僅支持網頁版
-
基於Netscope二次開發 -
給出網絡的各種計算操作次數(非常方便!)
-
其子工具提供了模型可視化的功能
-
其子工具提供了模型可視化的功能
Github 地址:
https://github.com/alexlenail/NN-SVG 畫圖工具體驗地址:
http://alexlenail.me/NN-SVG/
Github 地址:
https://lutzroeder.github.io/netron/
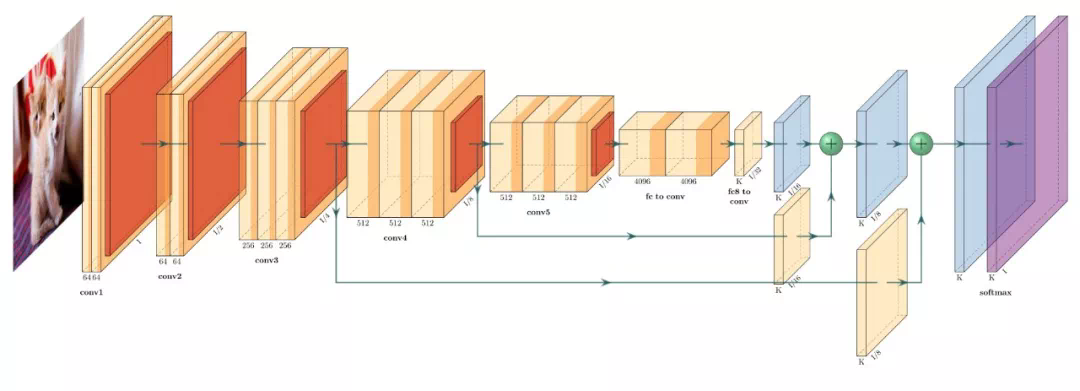
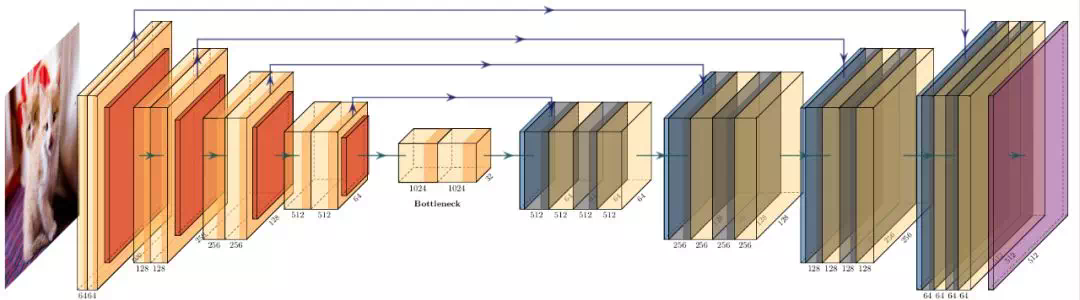
 PlotNeuralNet的使用方法非常簡單,將項目克隆下來之後,想用什麼結構,就從PlotNeural裏找對應的模塊,然後將它們拼接起來就好了,好比UNet:
import syssys.path.append('../')from core.tikzengimport *from core.blocks import *arch = [ to_head('..'), to_cor(), to_begin(), #input to_input( '../examples/fcn8s/cats.jpg' ), #block-001 to_ConvConvRelu( name='ccr_b1', s_filer=500, n_filer=(64,64), offset="(0,0,0)", to="(0,0,0)", width=(2,2), height=40, depth=40 ), to_Pool(name="pool_b1", offset="(0,0,0)", to="(ccr_b1-east)", width=1, height=32, depth=32, opacity=0.5), *block_2ConvPool( name='b2', botton='pool_b1', top='pool_b2', s_filer=256, n_filer=128, offset="(1,0,0)", size=(32,32,3.5), opacity=0.5 ), *block_2ConvPool( name='b3', botton='pool_b2', top='pool_b3', s_filer=128, n_filer=256, offset="(1,0,0)", size=(25,25,4.5), opacity=0.5 ), *block_2ConvPool( name='b4', botton='pool_b3', top='pool_b4', s_filer=64, n_filer=512, offset="(1,0,0)", size=(16,16,5.5), opacity=0.5 ), #Bottleneck #block-005 to_ConvConvRelu( name='ccr_b5', s_filer=32, n_filer=(1024,1024), offset="(2,0,0)", to="(pool_b4-east)", width=(8,8), height=8, depth=8, caption="Bottleneck" ), to_connection( "pool_b4", "ccr_b5"), #Decoder *block_Unconv( name="b6", botton="ccr_b5", top='end_b6', s_filer=64, n_filer=512, offset="(2.1,0,0)", size=(16,16,5.0), opacity=0.5 ), to_skip( of='ccr_b4', to='ccr_res_b6', pos=1.25), *block_Unconv( name="b7", botton="end_b6", top='end_b7', s_filer=128, n_filer=256, offset="(2.1,0,0)", size=(25,25,4.5), opacity=0.5 ), to_skip( of='ccr_b3', to='ccr_res_b7', pos=1.25), *block_Unconv( name="b8", botton="end_b7", top='end_b8', s_filer=256, n_filer=128, offset="(2.1,0,0)", size=(32,32,3.5), opacity=0.5 ), to_skip( of='ccr_b2', to='ccr_res_b8', pos=1.25), *block_Unconv( name="b9", botton="end_b8", top='end_b9', s_filer=512, n_filer=64, offset="(2.1,0,0)", size=(40,40,2.5), opacity=0.5 ), to_skip( of='ccr_b1', to='ccr_res_b9', pos=1.25), to_ConvSoftMax( name="soft1", s_filer=512, offset="(0.75,0,0)", to="(end_b9-east)", width=1, height=40, depth=40, caption="SOFT" ), to_connection( "end_b9", "soft1"), to_end() ]def main(): namefile = str(sys.argv[0]).split('.')[0] to_generate(arch, namefile + '.tex' )if __name__ == '__main__': main()
Github 地址:
https://lutzroeder.github.io/netron/ 畫圖工具體驗地址:
https://www.lutzroeder.com/ai/netron/
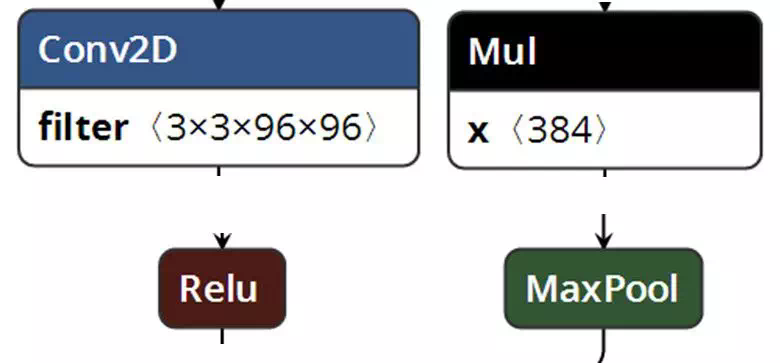
在使用方面,你可以直接訪問網頁端,上傳模型文件,就可以看到網絡結構圖,並可以進一步利用pip安裝並引入到程序中通過瀏覽器查看模型的變化。
如果你想追求個性化設置,可以在Github上下載源碼修改相應的設置。如端口後的修改可以在src/__init__.py中修改,字體顏色可以在src/view-grapher.css中修改。效果如下圖所示:
